Reservoir characterisation of deep water deposits: A case study from MMF30 interval, Hai Thach field, Nam Con Son basin
Summary
A good understanding of the complexity and architecture of a deep water reservoir type becomes ever more important to optimise its development and production. Recent technology advances such as higher resolution 3D seismic data combined with sequence stratigraphy in deep water reservoir settings and well log evaluation have resulted in enhancement of the understanding of turbidite complex reservoirs. In MMF30 reservoir, the turbidite sand is of good quality with sand thicknesses between 31m and 52mTVDSS, the average effective porosity between 14% and 16%, and shale volume between 22% and 29%.
Key words: Turbidite, reservoir characteristic, seismic attributes.
1. Introduction
Hai Thach field is located in Block 05-2, Nam Con Son basin. It was discovered by the exploration well 1 drilled on the Hai Thach horst structure. The well found gas and condensate accumulations in multiple stacked sand in Upper Miocene (UMA10), Middle Miocene (MMH10), and Lower Miocene (LMH10, LMH20 and LMH30). Well 1 has not met MMF30 reservoir. An appraisal well (well 2) was then drilled on the eastern flank of the structure and encountered additional hydrocarbon-bearing Upper Miocene (UMA15) and Middle Miocene (MMF10, MMF15 and MMF30) sandstones.
The MMF30 reservoir was deposited in the deep marine environment during the syn-rift of Nam Con Son basin. This reservoir has then been confirmed by three more producing wells, namely well 3, well 8, and well 9. According to well evaluation, MMF30 interval is a good reservoir with 14 - 16% average effective porosity and the gross sand thickness from 31m to 52mTVDSS. The distribution of this reservoir was also mapped by using seismic attributes such as AVO and Spectral-decomposition (Discrete Fourier Transform). This attribute mapping shows the fan size of approximately 2km in width and 5km in length.
The research on MMF30 reservoir characterisation and implication was carried out to understand the reservoir quality, distribution, and connectivity in order to optimise the field development and production.
2. Geological setting
Block 05-2 is located in a rift basin, named Nam Con Son basin, which overlapped the Indochina platform structure. Rift pulses occurred from the Palaeogene to the earliest Late Miocene. The general stratigraphy and structure were recorded as the pre-rift stage during Eocene to Early Oligocene, the first syn-rift stage from late Early Oligocene to Late Oligocene, the subsidence stage during Early Miocene; the second syn-rift stage up to Middle Miocene and the post-rift from Upper Miocene to recent time [1,2]. The rifting period contains the study interval (MMF30 reservoir).
Depositional environment during rifting phase were predominantly shelfal to basin floor with both clastic and carbonate sediments preserved, the upper part of this composite sequence is characterised by the preservation of deeper water clastic sediments. There is an overall back- stepping of facies belts observed from T40 to T60 (MMU), and an increased variation in facies, palaeoenvironments and thickness. The uplift and/or magnitude of erosion on some footwall highs have resulted in the absence of T60 (MMU), either through non-deposition or erosion. The top of MMU is the most prominent unconformity in the Nam Con Son basin. It is characterised by local erosional truncation, and by a basinward shift of facies in deep-water settings. Structural discordance is locally developed, and is observed best in the southeast where it is interpreted to result from footwall uplift and mild inversion. The unconformity was enhanced in deeper marine settings by submarine channelling which eroded underlying sections, and may itself have been further modified by subsequent younger channelling events. Nannofossils and foraminifera date T60 as Middle-Miocene [1].
3. Database and methodology
Datasets used in this study include high- resolution 3D seismic data in both time and depth domain, four (4) wells with full log curves, FMI (1 well), conventional core images (1 well) and some results of petrographic analysis of wells (4). The 3D seismic data covering an area of approximately 1,000km2 are of very good quality with high resolution, inline and crossline spacing of 12.5 x 12.5m. The dominant frequencies are from 30Hz to 60Hz. The seismic attributes including AVO and Spectral-Decomposition were used to interpret and predict distribution of turbidite MMF30 reservoir. The workflow of this research is defined in the following steps:
• Step 1: Sequence stratigraphy and paleoenvironment study;
• Step 2: Seismic attribute analysis;
• Step 3: Well log evaluation;
• Step 4: Structural sedimentology interpretations.
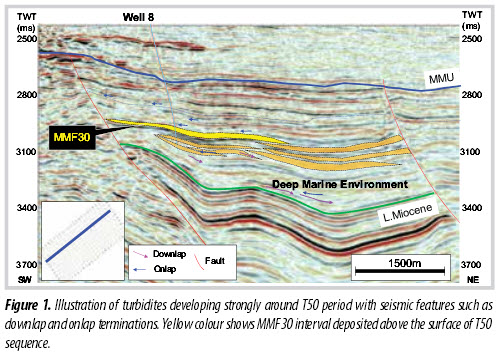
Step 1: Sequence stratigraphy and paleoenvironment study According to seismic sequence stratigraphy, it can be seen
clearly that MMF30 interval was formed within the period of strong development of turbidites/slumps as downlap and onlap terminations (Figure 1) [3]. This interpretation has been supported by other data, such as biostratigraphy and sedimentology features.
Step 2: Seismic attribute analysis
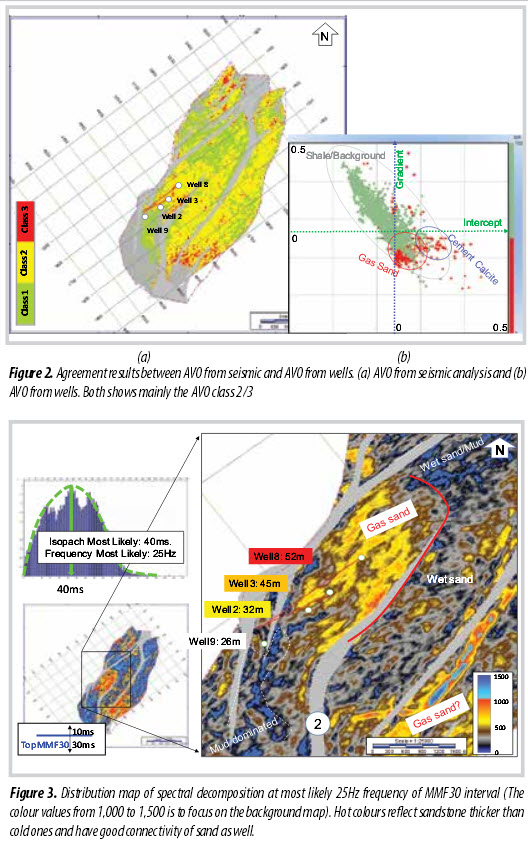
Based on well logs, parameters of Vp, Vs, RHOB and NPHI of the four wells 2, 3, 8 and 9, AVO classes could be predicted as class 2 or 3 mainly (Figure 2).
Both AVO and Spectral decomposition attributes have been carried out to map MMF30 reservoir distribution.
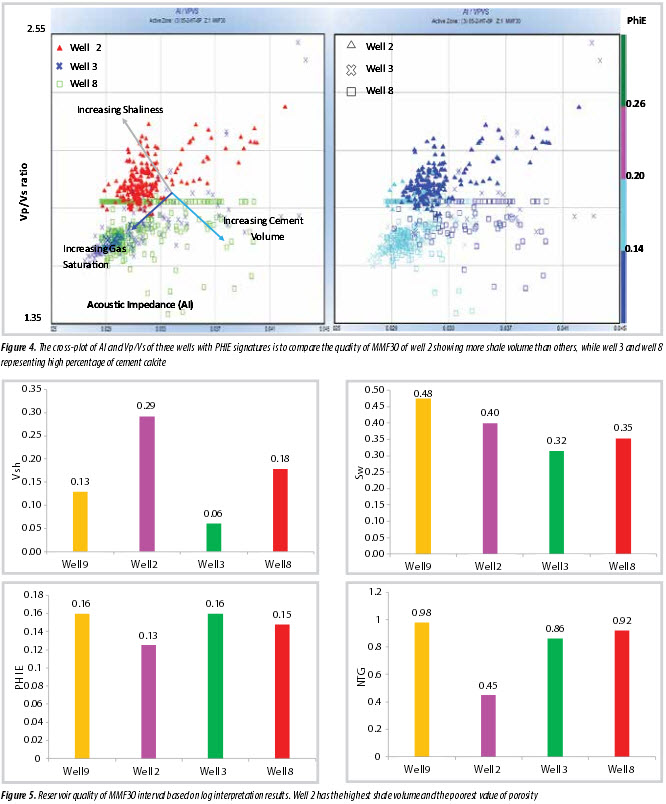
Spectral decomposition is a relatively common processing technique that allows anomalies to be identified corresponding to not only the sand distribution but also the presence of hydrocarbon in a reservoir (Figure 3) [4].
Step 3: Well log evaluations
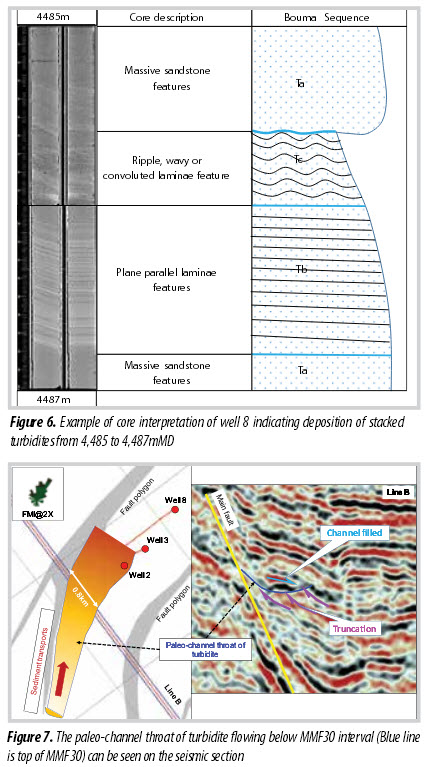
Integrated data of log analysis and petrography for MMF30 reservoir qualitatively and quantitatively for four wells were evaluated to improve the understanding of the reservoir characterisation and implication. The results of well-log interpretations were demonstrated and compared to each other (Figures 4 and 5).
Step 4: Structural sedimentology interpretations Generally, Bouma sequence is a favourite sequence deposited within deep marine environment. Each single Bouma sequence contains specific sedimentology structures. Ta has massive sand graded feature, Tb has plane parallel laminae feature, Tc has ripple, wavy or convoluted lamilae features and other upper layers (Td, e) are massive shale graded. According to conventional core images of well 8, the base of turbidite and its features of each sequence can be observed and interpreted as well (Figure 6) [5].
4. Results and discussion
According to published studies, MMF30 reservoir is deposited in deep water environment and interpreted as turbidite deposits. Moreover, based on conventional cores taken from well 2 and well 8, turbidite deposits cycles named Ta, Tb and Tc can be observed clearly. They were known as cycles of Bouma sequence (Figure 6). In addition to seismic sequence stratigraphic features, MMF30 interval was recognised as downlap and onlap terminations (Figure 1). These features were formed during sedimentation of turbidite deposits. The paleo-thrust submarine fan was seen clearly on seismic sections as truncational facies.
Integrated with FMI interpretation, the direction of the main sediment supply is from SW to NE (Figure 7) [6].
Distribution of MMF30 reservoir can be seen and mapped on both attribute maps (AVO and Spectral Decomposition). Figure 3 of Spectral Decomposition map shows dimensions of the MMF30 sand fan approximately 2km in width and 5km in length. The dim area to the South - South West of well 2 could be related to lithology change from sandy to muddy facies. The red line in the North East reflecting bright to dim amplitudes could be linked to fluid phase change (gas to water contact). Fault 2 as labelled on the map is post-depositional fault, therefore the lithology on both sides could be similar. Thus, the difference in AVO/Spectral Decomposition map in both hanging wall and footwall likely relates to fluid types (gas reservoir on the footwall and water wet on the hanging wall).
The cross-plots of petrophysical parameters of MMF30 reservoir can be evaluated and verified by the results of log interpretation as well [7, 8]. Average porosity varies from 13% (well 2) to 16% (well 3) with gross sand thickness variation from 31 to 52 metres. This reservoir is a gas bearing zone with 60% to 70% of gas saturation. These results show that the quality of MMF30 at well 2 has not reflected so well as others (Figures 4 and 5).
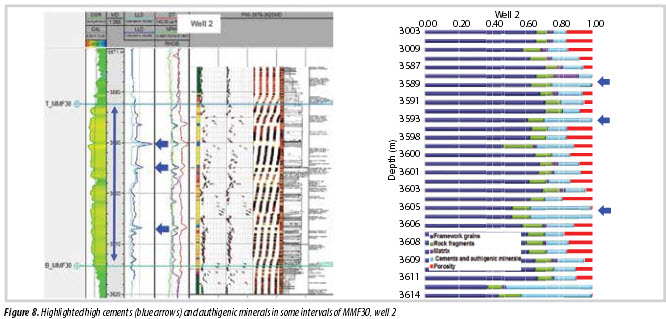
Sedimentological analysis of well 2 cores indicates the lower slope to inner submarine fan depositional setting for MMF30 sequence (Figure 8). Further to the North East of well 2, the core features of well 8 show numerous stacked turbidite deposit cycles with thick massive sand in the lower part indicating rapid deposition and it is overlain by lamination sand and shale layer which can be contributed to different portions of a Bouma sequence. This is reflected by the sedimentological structures of core samples at well 8 (Figure 6). The debris-flow deposits which are indicated in well 2 by abundant mud-clast with different orientation cannot be clearly recorded in well 8. This suggests that the progradation of shelf-slope during formation of MMF30 interval was limited around well 2 and it did not extend to well 8. Well 8 is therefore mostly located in inner to mid submarine fan. The well log curves of well 3 and well 8 show amalgamated stacking patterns on GR curve indicating their formation during the regressive period. The formation of transgressive shaly layer in the middle part of well 2 could be related to a rapid flooding period which cannot be observed in the other two wells. In general, there are series of SW-NE elongated stacked fan-lobe turbidites in Hai Thach field which are probably resulted from syn-rift activities of southwest-northeast trending faults during the Middle Miocene.
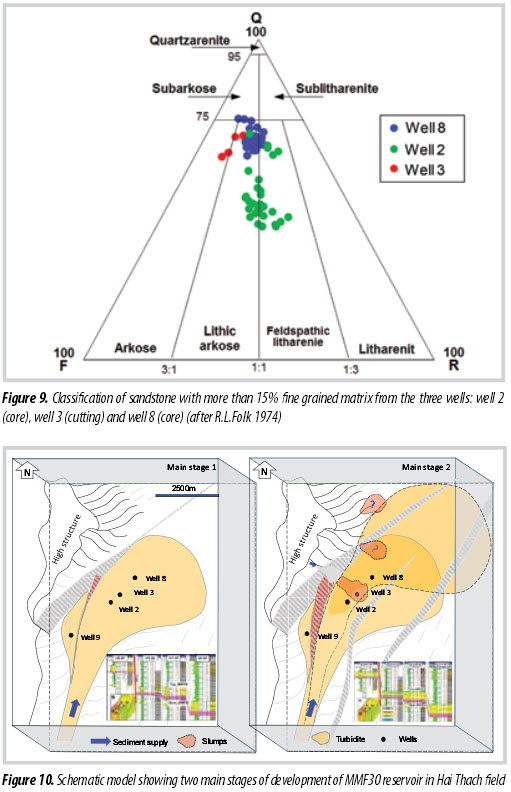
According to sedimentological analysis, MMF30 interval is mostly fine to very fine sandstone with moderate to well sorted, which are subjected to Lithic Arkorse/Feldspathic Litharenite in Fold’s classification (Figure 9). Classification of sandstone with more than 15% fine grained matrix among these wells indicates lower proportion of quartz contents of well 2 than that at wells 3 and 8. This could be interpreted that sediments at the well 2 location were deposited closer to the source supply than that at wells 3 and 8 due to the presence of less amount of any stable materials (quartz). Moreover, petrography analysis shows that the high cement content of calcite is an important key factor to reduce porosity. In addition, some thick calcite veins observed from log curves and sample analysis could be deposited from high carbonate structures formed in previous time (Early Middle Miocene) nearby Hai Thach field (Figure 8).
By integrating all data, it aims to define detailed subsurface for correlation of MMF30. As mentioned, some clear subsurfaces can be recognised to separate MMF30 interval into at least 3 main different zones. According to the correlation of MMF30, the conceptual model environment for this interested interval was constructed to demonstrate the MMF30 deposits. Figure 10 represents two main stages of MMF30 turbidites formed. Some slumps locally could be formed during the syn-rift period from local high structures.
It can be seen that a strong linkage between physical stratigraphy, depositional environments and reservoir architecture has been found in the MMF30 reservoir, turbidite sandstone. The advantages and limitations of development and production management at MMF30 reservoir provide a unique chance to test many of these deep-water reservoir/turbidite sandstone concepts, assumptions and interpretations regarding reservoir heterogeneity, connectivity and lithofacies distribution. These understanding and learnt lessons will be critical to the successful pursuit of future deep-water exploration, development and production opportunities.
5. Conclusions
Integration of geological and geophysical data showed the quality of MMF30 reservoir around the well 8 area is the best and decreasing to the North West (well 2) direction. Cores and log signatures around well 8 and well 3 show an amalgated sheet sand features (Mid fan) while around well 2 in upper most of fan with sand connectivity reducing around upper and outer fans. Some calcite veins could be considered as good markers and correlated from well to well.
References
1. S.J.Matthews, A.J.Fraser, S.Lowe, Simon P.Todd, Frank J.Peel. Structure, stratigraphy and petroleum geology of the SE Nam Con Son basin, offshore Vietnam. Geological Society London Special Publication. 1997; 126(1): p. 89 - 106.
2. Phung Van Phong, Nguyen Thanh Tung, Khuc Hong Giang, Nguyen Xuan Phong. Pliocene - Pleistocene sequence stratigraphy in Block 05-2, Nam Con Son basin, offshore Vietnam. Petrovietnam Journal. 2016; 10: p. 14 - 19.
3. Paul C.H.Veeken, Bruno Van Moerkerken. Seismic stratigraphic techniques. In “Seismic stratigraphy and depositional facies models”. 2013: p. 105 - 214.
4. Paul C.H.Veeken, Bruno Van Moerkerken. Seismic interpretation and reservoir characterization. In “Seismic stratigraphy and depositional facies models”. 2013: p. 375, 377 - 410.
5. Arnold H.Bouma. Sedimentology of some Flysch deposits: A graphic approach to facies interpretation. Elsevier. 1962.
6. Julian D.Clark, K.T.Pickering. Submarine channels, processes and architecture. 1996.
7. J.Ardill, R.Jensen, S.Evans, T.Garfield, R.Beaubouef. Deepwater reservoir characterization and implications for hydrocarbon production - An example from the Zafiro field, Equatorial Guinea. Offshore Technology Conference, Houston, Texas, USA. 2 - 5 May, 2005.
8. B.Doligez, H.Beucher, F.Geffroy, Eschard Rémi. Integrated reservoir characterization: Improvement in heterogeneous stochastic modeling by integration of additional external constraints. 1998.