Summary
PVT data are essential for proper field development plan, accurate reserve estimation, reservoir simulation, material balance calculation, and optimum fluid recovery plans. High quality and accurate PVT data can, therefore, reduce uncertainty in reservoir fluid properties and set the stage for reservoir engineering modelling whilst improving the technical work on which investment decisions are made. Poor quality data will, however, result in lost time due to rework and additional studies, poor development plans, and inefficient investment.
This paper focuses on the testing of the quality of the PVT data from DH-8X-DST#4 performed in the lab based on Hoffman plot, material balance, and Buckley plot.
Key words: PVT, material balance, Hoffman, Buckley, Dai Hung field.
1. Introduction
Quality control (QC) of PVT data is very important. Improper quality control or any error in the recorded data can be misleading in the next steps of fluid modelling, fluid properties measurement, and construction of thermodynamic model for representative reservoir fluid. It is, therefore, important to conduct fluid sampling and recombination using standard protocols to minimise errors and uncertainties. In this paper, we introduce quality control of PVT measurements on collected gas and liquid samples within a reservoir to select the representative reservoir fluid. After that, the representative reservoir fluid will be used for simulation.
2. Methodology
a) Graphical technique
Graphical plots [1] of the non-compositional data as a function of pressure were made. The following properties were plotted against pressure to check the quality of the PVT data: relative volume, Y-function, density, solution GOR and oil FVF, the graphs are expected to show a smooth trend.
b) Hoffman plot
The Hoffman plot [1] is another method of evaluating the quality of compositional data. This method utilises a log-linear plot of K-value versus Hoffman factor, F. F (psi/ oR) is defined as follows:

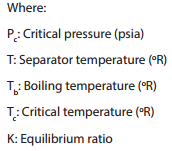
A plot of Log (K) versus F for each component of the separator liquid and reservoir fluid compositions will be expected to yield a linear graph which implies high quality data where all points plotted are expected to fall close to the line of best-fit.
Equilibrium ratios trend (K): The equilibrium ratio [2], Ki, of a given component in a hydrocarbon mixture is defined as the ratio of the mole fraction of the component in the gas phase, yi, to that of the mole fraction of the component in the liquid phase, xi. Mathematically, the relationship is expressed as:

The K-value measures the tendency of the component to remain or escape to the gas phase. It is essentially a property that measures the volatility of the component at a pressure and temperature. This tendency suggests that in a multicomponent system, components’ Ki-value should follow the trend of their decreasing K-values with the increasing order of their normal boiling point; that is

c) Material balance
The material balance test [1] was used to evaluate compositional consistency. It was applied on the separator liquid and reservoir fluid compositions. The material balance equation is expressed below.
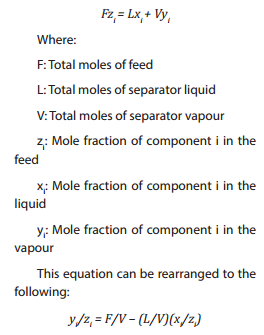
A plot of yi/zi against xi/zi should give a straight line with a slope of –L/V and an intercept of F/V. Any deviations from a straight line reflect material balance discrepancies. Reservoir fluid compositions are typically calculated from a mathematical recombination of flashed vapour and liquid compositions. When feed compositions are determined from a mathematical recombination of the separator vapour and separator liquid compositions, a perfectly straight line should be observed in the plot. In this case, the plot is sometimes useful for identifying discrepancies in the reported compositions. The reciprocal of the slope of the line can then be used to calculate the GOR and compare that with the reported GOR. The liquid density and molecular weight must be provided so that the conversion from moles to barrels can be made. When the feed composition is truly independent from the vapour and liquid compositions, the material balance test provides a good check on the overall consistency of the analyses [3].
d) Buckley plot
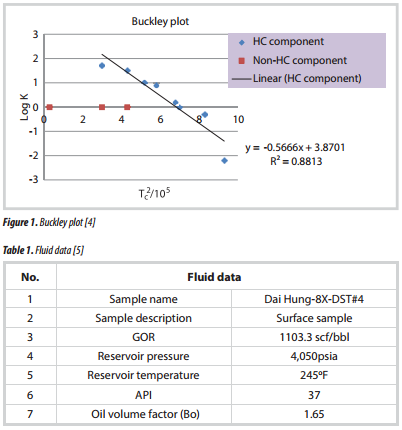
The Buckley plot (Figure 1) is expressed by the semi logarithmic plot of K-value versus the square of the critical temperature Tc of the reservoir fluid [4]. It gives a straight line with negative slope for the light hydrocarbon components and any significant deviation indicates possible non-equilibrium separation or numerical errors in the data reporting. As a component becomes less paraffinic then the deviation from the linearity becomes greater.
3. QC of DH-8X-DST#4 Sand 0
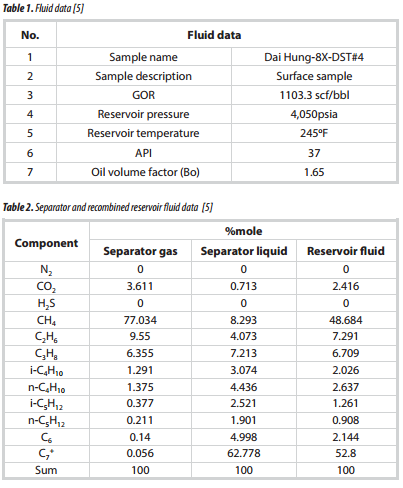
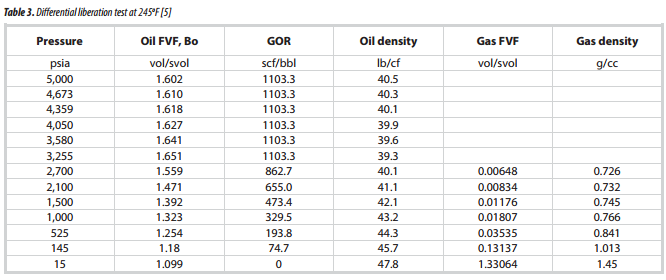
The result of PVT analysis from DH-8X- DST#4 is shown in Table 1 - 3.
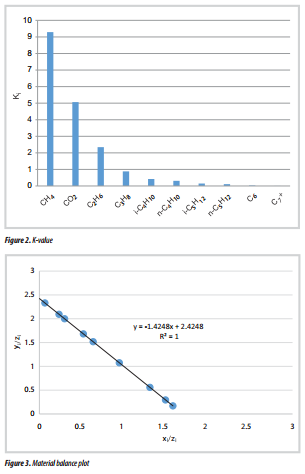
Based on Table 2, the equilibrium ratio for each component was calculated as shown in Figure 2, which indicates a consistency in the laboratory-reported compositional analysis.
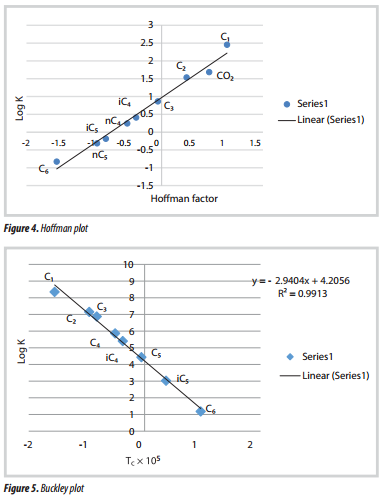
Figure 3 is the resulting material balance plot when yi/zi is plotted against xi/zi. In this case, the plot from the material balance of separator liquid and reservoir fluid compositional data shows a linear trend. This confirms the high quality and accuracy of compositional data obtained. The slope of the line in the figure is -1.4248, which can be converted to a GOR of 1,102.5 scf/bbl by taking the negative reciprocal of the slope and converting it to the measured unit. This calculated GOR is about 0.01% lower than the reported laboratory value of 1,103.3 scf/bbl. The difference is very small, indicating that the liquid molecular weight, liquid density, and recombination ratio all appear reasonably consistent with the reported GOR.
The Hoffman plot is a standard technique for evaluating the consistency of the recombined fluid samples through a graphical technique. Usually the plus fraction (e.g. heptane-plus (C7+)) is not included in Hoffman consideration because it is generally not measured accurately [2]. To further control the quality of the recombined compositions listed in Table 2, the compositions were used to generate the Hoffman plot as shown in Figure 4, which confirms that the separator liquid and reservoir compositional data are of high quality, as the plotted points lie close to the line of best fit for components C1 through C6 for all pressure.
The plot from Buckley plot (Figure 5) is expressed by the relationship of Log K versus Tc for the reservoir fluid. A semi log plot of K value versus the square of the critical temperature gives a straight line with a negative slope for the hydrocarbon components (C1 - C6). This confirms the high quality and accuracy of the compositional data obtained.
4. Conclusions
In order to obtain trustworthy PVT fluid properties, the quality of the samples must be examined carefully. Three other techniques for evaluating the consistency of flash and composition data have also been applied for a long time, but they are still very useful today. These methods are material balance, Hoffman and Buckley plots. The material balance plot can be used as a rigorous criterion for consistency while the Hoffman plot and the Buckley plot are considered qualitative assessment of data quality.
Application of this methodology on the PVT data from DH-8X-DST#4 under study showed that the samples can be used as representative for the whole reservoir.
References
1. Nnaemeka Nnamdi Nnabuo. Interpretation of laboratory PVT analysis result (a case study of a Niger delta field). SPE 172412-MS. SPE Nigeria Annual International Conference and Exhibition, Lagos, Nigeria. 5 - 7 August, 2014.
2. Tarek Ahmed. Equations of state and PVT analysis. Applications for Improved Reservoir Modelling. 2016.
3. John J. Lawrence. Qualityassessmentand consistency evaluation of hydrocarbon PVT data. SPE 13784-MS. SPE International Petroleum Technology Conference held in Doha, Qatar. 7- 9 December, 2009.
4. Julius Akpabio, Sunday O.Isehunwa, Oluwatoyin Akinsete. PVT fluid sampling, characterization and gas condensate reservoir modeling. Advances in Research. 2015; 5(5): p. 1 - 11.
5. PVEP POC. PVT report of DH-8X-DST#4.
6. John M.Williams. Getting the best out of fluid samples. SPE 29227-PA. 1994; 46(9).
7. Alan Graham Stephen, David F.Bergman, Tim Dodd, Wayne Kriel. PVT data quality: Round Robin result. SPE 116162-MS. SPE Annual Technical Conference and Exhibition. Denver, Colorado, USA. 21 - 24 September, 2008.