ORGANIC AND INORGANIC FORMATION DAMAGE AND REMEDIATION
Summary
Organic and inorganic skin damage in oil producing wells is a major factor in the loss of productivity and revenue. Paraffin, asphaltene, scale deposition and emulsions in the formation and around the wellbore create a barrier for the transportation of crude oil through the formation to the tubing. Many producing wells have experienced a production decline that cannot be explained by reservoir depletion. Organic and inorganic damage may occur naturally or through various intervention practices used in the oilfield. An increased awareness of the potential for ongoing damage has been developing slowly over time. Better methods of problem identification, programs to remediate these problems and stimulation software have been developed in recent years. The paper discusses potential sources of organic and inorganic damage, problem identification test techniques, stimulation software, chemical selection and applications. A number of brief case histories are presented as examples.
Key words: Organic, inorganic, paraffin damage.
1. Introduction
Skin damage in a producing well is a combination of contributing factors from two general groups. The sources for organic deposition are comprised primarily of paraffin and asphaltene deposition. The sources for inorganic damage are various scale deposits, sand, silt and clay migration.
The organic sources are naturally occurring components of crude oil. Paraffins are composed of only carbon and hydrogen atoms with a carbon chain length starting at C18-20 up to C70 or higher. Though paraffins are usually straight-chained hydrocarbons, they can also contain a variety of branched alkyl or cyclic groups. Asphaltenes are heterocyclic unsaturated macromolecules consisting primarily of carbon, hydrogen, and minor components such as sulfur, oxygen, nitrogen and various heavy metals. These higher molecular weight components of crude oil are in equilibrium at “normal” reservoir condition. As crude oil is produced this equilibrium is upset by a number of factors such as temperature declines, pressure reductions, addition of miscible gases and liquids, acidising, hot oiling and other oilfield operations. The primary mechanism for paraffin deposition is thermal cooling. Decreases in temperature promote paraffin deposition. The key mechanisms for asphaltene deposition are the decrease in pressure and the introduction of incompatible fluids [1 - 3].
The inorganic sources are naturally occurring components in the produced water or from the formation matrix. Scale deposits are composed of a variety of inorganic compounds, but most commonly calcium carbonate, barium sulfate and calcium sulfate. These scale deposits can form under natural production conditions or as the result of mixing incompatible water sources. Incompatible water sources can be the result of production from multiple formations, water flooding or water based fluids injected into the well for a variety of well related activities such as fracturing, salt block removal, and well killing, etc. A variety of formation material consisting of sand, silt and clay can migrate through the formation and plug pore throats to impact production. These particles can become oil-wet and agglomerate into larger masses creating even greater plugging potential. All these sources of potential damage migrate and accumulate in the near wellbore regions. All the well production fluids and gas have to be squeezed through an ever decreasing smaller number of pores as they approach the wellbore. This leads to a buildup of skin over time and the resulting decrease in the potential productivity of the well.
2. Problem identification
In order to solve the damage problem in the most cost efficient manner, it is necessary to identify the primary source of the damaging mechanism in a particular well. First, one would want to gather as much information on the particular well in question as possible through a systems analysis. This information would consist of production history, current production rates of oil, gas and water, drive type, well depth, temperature and pressure profile, well configuration, fluid level, enhanced oil recovery technique, stimulation and maintenance history.
Secondly, a series of laboratory testing on samples of crude oil, water and solid deposits would be conducted to characterise these fluids. The crude oil is characterised by wet chemical and instrumental analysis for % paraffin,
% asphaltenes, % asphaltic resins, % aromatic and % saturates. A cloud point, pour point, gas chromatograph and viscosity profile is also run. Water samples would be tested using ICP for elemental analysis and the scaling index calculated using any of a variety of scale modelling softwares to determine the scaling tendencies. Solid deposits would be characterised through wet extraction methods, Fourier transform-infrared spectroscopy (FTIR), high-temperature gas chromatography (HTGC), x-ray diffraction (XRD) and x-ray fluorescence (XRF) for compositional information.
A series of selected specialised deposition/instability tests is run to investigate the potential for deposition from the various samples. For paraffinic crudes these consist of paraffin deposition tests using cold fingers or other thermal deposition devices. The potential for asphaltene deposition is studied by conducting depressurisation studies on live oils to determine the asphaltene flocculation point. For surface samples of crude oil a variety of asphaltene instability tests are conducted. These consist of flocculation point determinations using a variety of anti-solvent titration and measurement techniques such as APDU, Turbiscan and ACSAA (Analytical Centrifuge Stability Analysis for Asphaltenes). From the information gathered using these various tests, the source and magnitude of the problem can be identified. Primary, secondary and even tertiary problem sources can be identified as drivers for formation damage.
A third step in the process is an analysis of the well production history gathered in step one. Generally, a target candidate will have a production decline which is much higher than the field average. Candidate wells can have fluid build-up studies conducted to eliminate reservoir depletion as the possible source of production decline. This also establishes a baseline of damage for future review. Often, fluid build-up studies are not available or deemed to be too costly to conduct on marginal wells. In this instance it is necessary to use the production history as the primary method of candidate well selection. The complexity of the well configuration and formations to be treated should also be considered. The physical location of the well, size of perforated interval, number of zones and completion type are just a few of the parameters to consider during the candidate selection. Less complicated wells will have lower over-all treatment costs. Ideal candidates for treatment and rapid payback are single zone completions with small-perforated intervals. These wells require a minimum amount of equipment and are the easiest and the least expensive to treat. For these treatments the chemical cost may represent 80 - 90% of the job cost. At the other end of the spectrum would be horizontal wells with very long offsets or any deepwater subsea wells. These require a substantial amount of equipment to perform the job. This adds additional cost and potentially reduces the chemical component cost to about 10 - 20% of the total job cost. Each well’s economic analysis needs to take these factors into consideration when evaluating the potential for success of the job.
3. Laboratory testing
Analysis and testing of crude oil samples is of critical importance for identifying the potential source of the organic damage. The potential for paraffin deposition organic damage is determined by running a number of tests. The cloud point (wax appearance temperature) of the crude oil is determined using a cross-polarised microscope. A cooling rate of 1°F per minute is typically used, although this is sometime reduced to as low as 0.1°F per minute for special cases. High temperature gas chromatography (HTGC) provides information on the % paraffin and carbon number distribution of the paraffin wax. Particular attention is focused on the amount of paraffin with carbon numbers in excess of 50 which have very low solubility in the oil and corresponding high melting points. Often HTGC runs on crude oil samples will indicate no paraffin waxes above C44 because the amount of wax present falls below the detection limits of the equipment. Paraffin waxes in crude oil samples can be concentrated by wet chemical analysis methods to enhance the response level of the high carbon chain length waxes in the oil. Concentrating the paraffins can provide indications of paraffin up to or above C70 in those same oils.
The temperature profile of the system is examined to determine if the cooling from gas expansion could promote localised paraffin deposition in the formation around the well bore. A heat transfer software package is used to make these calculations. The history of the well is also reviewed for evidence of hot oil treatments to control tubular paraffin deposition. A history of hot oiling down the casing and particularly down the tubing is a good indicator of paraffin damage. This is particularly true if the bottom hole temperature is within 30°F of the crude oil’s cloud point. The actual cloud point of crude oil used for hot oiling down the casing has been shown to be in excess of 30°F higher than the normal cloud point in previous field investigations. Paraffin damage from hot oil or water down the tubing can be substantially greater where even higher molecular weight and melting point wax tubing deposits are pushed into the formation.
Paraffin deposition problems are verified in the laboratory by running cold finger studies on the crude. The crude oil is held at a temperature 5°F above the cloud point and a cooled probe is inserted into the oil. The temperature of the cooled probe is held at a predetermined level. This is usually 10 to 20°F below the oil temperature. The test is normally run for a period of 16 - 24 hours. The probes are then removed and the deposits removed from the probes and analysed for paraffin content and gravimetric weight. A wide variety of cold finger designs as well as other pipe loop configurations are used to study paraffin deposition.
The potential for asphaltene deposition damage is assessed by conducting a SARA (saturates, aromatics, resins, asphaltenes) whole oil analysis. A CII (colloidal instability index) is calculated using the following equation:
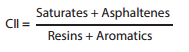
A historical database was developed over years of fluid’s analysis and correlated to field related problems to develop the critical value for the CII. For ratios of 0.9 or above, the crude oil has been shown to be unstable and asphaltene deposition problems are evident in the field. [4].
This instability can be observed in the laboratory by titratingtheoilwithavarietyoflinearhydrocarbonsolvents. This test is referred to as the APDU test. Typically, hexane, heptane or cetane is used to titrate the crude oil to view the on-set of asphaltene flocculation and precipitation. Different values are obtained for each solvent used, but these can be standardised to achieve relative stability numbers for each crude oil. The Turbiscan test method is similar to the APDU in that instability is measured, but generally the ratio of dilution solvent is much higher and the speed of asphaltene precipitation is measured and recorded over a fifteen-minute period. The Baker Hughes ACSAA test method is similar to the Turbiscan method, but uses a variety of test solvent solutions, higher oil ratios and adds the benefit of centrifugal force to enhance the measurement method [5].
If a live-oil sample is available then it would be possible to run a de-pressurisation study on the crude oil to identify the asphaltene onset precipitation (AOP) as a function of pressure. This would indicate the operating pressure range where asphaltene deposition would be possible. De-pressurisation studies on live-oil samples indicate the AOP pressure can be thousands of psi higher than the bubble point of the crude oil. This effectively broadens the area of concern for asphaltene organic damage in many systems.
For remediation of asphaltenes, it is generally best to perform chemical evaluation on a solid asphaltene sample from the field. With a solid asphaltene sample, a series of dissolution tests can be run with various additives to determine which is best for removal. If a solid sample is not available then dead oil samples are employed to determine the most effective chemical. Asphaltenes can be adsorbed onto various formation materials through the use of cores or packed columns to determine which additives are the best for removal of the adsorbed asphaltenes.
Laboratory tests for inorganic deposits make use of the compositional data generated in the problem identification steps (water analysis, scaling index values, deposit XRD and XRF) to focus on selecting the proper treating solution. Selected treating solution mixtures are run on actual field scale deposits or lab prepared analogs to determine the effectiveness of various packages. These packages generally consist of different organic and inorganic acids, surfactants, chelators, converters and dispersants. The preferred package is one that dissolves the greatest amount of the depositing compounds with the least impact on the production system.
3.1. Case history 1
A larger volume production well in Mexico had experienced a production decline from 13,500 barrels of oil per day to 10,500 barrels of oil per day over a six-month period. This problem was identified, through fluid analysis and laboratory instability testing, to be an asphaltene depositionproblemfor this 32APIcrudeoil. Thesinglezone limestone formation with a perforated interval of 197ft was treated with a solution of 2,300 gallons of dispersant and 25,000 gallons of solvent. This provided a radial penetration of about 7ft. The treatment was pumped into the well and allowed to soak for 24 hours before resuming production. The well produced a maximum flow of 13,900 barrels of oil per day after the treatment and the average production rate was 13,700 barrels of oil per day for a four-month period. The treatment effectively halted the previous production decline rate of 600 barrels of oil per day. The incremental barrels of oil produced over the four- month period following the treatment versus what could be expected from the established decline curve was over 500,000 barrels of oil. The cost of the job was recovered in approximately 8 days.
3.2. Case history 2
A recently drilled horizontal sandstone formation well in California was experiencing problems. The well was producing a high viscosity emulsion, stabilised from residuals of the oil based drilling mud used during the drilling operations. The well had an initial production of only 70 barrels of oil per day and this had decreased to 50 barrels of oil per day at the time of the treatment. Coiled tubing was used to apply the treatment along the 1059-foot length of the production zone at the rate of 4.5 gallons per foot of perforation to achieve a 3-inch radial penetration outside the liner. The total job size was 4,864 gallons consisting of 2,434 gallons of crude oil and 2,434 gallons of a dispersant/solvent mixture. The well was shut- in for 24 hours and returned to production. On day 102, the well was producing 131 barrels of oil per day and the well had produced 10,575 incremental barrels of oil for this period. The increase in revenue for this well was USD 158,625 for the 102 days.
3.3. Case history 3
A well in Southern Oklahoma was experiencing paraffin deposition in the tubing and had to be cut on a quarterly basis. The production had decreased from 270 barrels of oil per day to 110 barrels of oil per day over a sixteen-month period. The well was fractured with 27,000 gallons of gelled oil containing 38,000 pounds of 20-40- mesh sand. The production increased to 440 barrels of oil per day, but decreased rapidly to 290 barrels of oil per day over the next seven months. Organic damage from paraffin deposition in the formation was suspected to be the major cause of the production decline. This was surmised from the positive results of the frac job, the rapid production decline following the job, the low scaling tendencies of the water and the history of tubular paraffin deposition. Rather than schedule another frac job, it was decided to investigate the possibility of removing the paraffin damage through the use of chemical remediation. A series of six chemical jobs were conducted over the next two years. The organic damage was not only removed, but the oil production was also increased to a high of 490 barrels of oil per day. This was 50 barrels of oil per day higher than that accomplished with the frac job. The oil production level was held above 400 barrels of oil per day for sixteen months with these treatments. Incremental oil production averaged in excess of 150 barrels of oil per day over the post-frac value of 290 barrels of oil per day. All of the chemical treatments were low cost with payout in less than 1 week. Additional details on this series of treatments are available in SPE 52156 [6].
3.4. Case history 4
A new in-field drilled well in California was completed with an acid job to stimulate the well. The well was put on a pumping unit and the production volume was expected to be 300 barrels of oil per day based on historical off-set well initial production values. Pumping was initiated but the well would not produce any fluids. Testing on off-set crude oil samples indicated the oil had a strong tendency to create acid slug and rigid film emulsions when the oil contacted the acid without the appropriate additives included in the acid stimulation job. 4 drums of chemical remediation product was pumped down the casing of the well and allowed to soak for 12 hours overnight. The well was put into production the next morning and produced 350 barrels of oil per day following the treatment.
3.5. Case history 5
Awellin Oklahomaunder CO2 floodwasexperiencing declining production and tubing deposition issues. The crude oil was 40°API and the well was 6,200ft deep. The field had been under CO2 flood for 10 years. Well tests conducted once every 2 weeks for the 6 month period prior to treatments averaged 44 barrels of oil per day, 49 barrels of water per day and 95 million Standard cubic feet per day. Fluid analysis of the oil indicated it contained 9% paraffin with a cloud point of 110°F and a pour point of 75°F. Water analysis and scale index modelling indicated scale was not an issue. The problem was treated as paraffin deposition in the formation. The well was treated with a chemical package specifically designed for paraffin remediation. Following treatment the well was tested once every 2 weeks for 10 weeks and the production averaged 68 barrels of oil per day, 74 barrels of water per day and 111 million standard cubic feet per day. The cost of the job was recovered in approximately 4 days.
3.6. Case history 6
A package of 6 wells in California was investigated for steeper declining rates than normal for the field. Fluid testing on the wells indicated a combination of oil wet fines and scale depositions was the primary cause of the production decline. The 6 wells were treated with a combination scale dissolver and surfactant package to de-oil the fines. The oil production increase for the 6 wells averaged 53.9% and the payback on the treatment cost was 23 days.
3.7. Case history 7
A deepwater well in the Gulf of Mexico was experiencing rapid production decline. Fluid testing indicated the problem was asphaltene deposition in the formation. The customer had a history of treating the well with large xylene soak treatments to boost production. Historically the well would decline to 2,400 barrels of oil per day prior to xylene treatment. Following a treatment using 400 barrels of xylene for the 98ft of perforated interval, the well production would increase by 1,700 barrels of oil per day to 4,100 barrels of oil per day. The well would then start to decline again and require re-treatment on a regular basis. The customer expectation was for an improved treatment over xylene alone that would boost production by 2,000 barrels of oil per day. A chemical solution designed specifically to remove asphaltenes from the formation matrix was designed and 100 barrels of the treatment was applied to the well. The initial production jumped 3,900 barrels of oil per day to 7,300 barrels of oil per day from the 2,400 barrels of oil per day rate just prior to treatment. The well averaged 6,000 barrels of oil per day for the first 6 weeks and had decreased slowly to 4,500 barrels of oil per day after 8 months. The incremental improvement in oil production for this 8-month period was 636,000 barrels of oil compared to the previously used xylene treatment.
3.8. Case history 8
Well 18Dr/RP-2 of Rong oil field was experiencing paraffin deposition in the tubing and had to be cut on a quarterly basis. The production had decreased from 685 barrels of oil per day to 145 barrels of oil per day over an 18-month period. This problem was identified, through fluid analysis and laboratory instability testing. Fluid testing indicated the problem was asphaltene deposition in the formation. Organic damage from paraffin deposition in the formation was suspected to be the major cause of the production decline. The customer had a history of treating the well with a large xylene, pour point depressant and activators treatments with parasqueeze technology to boost production. The treatment was pumped into the well and allowed to soak for 24 hours before resuming production. The well produced a maximum flow of 285 barrels of oil per day after treatment compared to 145 barrels of oil per day before treatment and the average production rate was 250 barrels of oil per day for a five month period.
3.9. Case history 9
The production of well 8011/BK17 of Bach Ho oil field had decreased from 620 barrels of oil per day to 275 barrels of oil per day over a year period. Fluid testing on the well indicated a combination of oil wet fine and scale deposition was the primary cause of the production decline. The well was treated with combination scale dissolver and surfactant package to de oil the fine. The oil production increased from 275 barrels of oil per day to 360 barrels of oil per day and this flow rate was maintained for 6 months.
4. Conclusion
The source and nature of organic and inorganic damage can be identified by laboratory testing and production history analysis;
Organic and inorganic damage is an ongoing process that decreases permeability and leads to subsequent oil production decline. Properly identified organic and inorganic damage can be removed from candidate wells and production restored to higher levels. Organic and inorganic damage removal by chemical treatment offers an alternative to more costly in-field drilling, fracturing and re-perforating operations;
Production gains from organic and inorganic damage remediation are transient since the damage process is ongoing. Re-treatment at regular intervals is recommended to maximise economic return.
References
1. Michael E.Newberry. Chemical effects on crude oil pipeline pressure problems. Journal of Petroleum Technology. May 1984: p. 779 - 786.
2. Michael E.Newberry, K.M.Barker. Formation damage prevention through the control of paraffin and asphaltene deposition. SPE 13796-MS. The 1985 SPE Production Operations Symposium, Oklahoma City, Oklahoma. 10 - 12 March, 1985: p. 53 - 61.
3. Michael E.Newberry, K.M.Barker, K.P.Flynn. Identification and remediation of organic skin damage. The 1999 AIChE Spring National Meeting, Houston, Texas. International Conference on Petroleum & Gas Phase Behavior and Fouling. 14 - 18 March, 1999.
4. Michael E.Newberry, K.M.Barker. Organic formation damage control and remediation. SPE 58723-MS. The 2000 SPE International Symposium on Formation Damage, Lafayette, Louisiana. 23 - 24 February, 2000.
5. D.W.Jennings, R.Cable, Michael E.Newberry. Asphaltene stability analyses for optimizing field treatment programs. SPE170677-MS. The 2014 SPE Annual Technology Conference and Exhibition, Amsterdam, The Netherlands. 27 - 29 October, 2014.
6. K.M.Barker, D.B.Sharum, D.Brewer. Paraffin damage in high temperature formations, removal and inhibition. SPE 52156-MS. The 1999 SPE Mid-Continent Operations Symposium, Oklahoma City, Oklahoma. 28 - 31 March, 1999.