MOVEMENT OF HOT ZONE AND AN EXPLANATION OF PROCESSES OCCURRING INSIDE A DOWNDRAFT GASIFIER
Summary
It is crucial to increase the level of understanding of some of the processes that occur in a biomass gasifier to advance the gasification technology. This was seen as a key requirement, as in many experimental and pilot-scale studies this aspect was missing, and in private discussions with a few investigators (from two different companies), this led to many questions about what was actually going on inside the unit, as this was not adequately explained in the literature that they had. In this study, an experimental system was designed, in which a visual section enabled observations of the gasification process to be made at a well-controlled location read. Gasification experiments were performed in a small scale, 21mm i.d. quartz tube gasifier. The biomass consisted of wood pellets (cylindrical, 13mm length x 5mm diameter), and this was packed to a height of 400mm in the tube. The air was fed into the top of the tube under a slight positive pressure of 0.1bar (g) and the flow was varied from 1 to 5 litre/minute (STP). The position and height of the red-hot zone inside the quartz tube could be observed, and the composition of the resulting gas measured. Depending on the air flowrate, the hot zone may move upwards or downwards. This important visual observation provides useful insight into what is occurring inside the gasifier, and the complexity and roles of the various reaction zones in a downdraft gasifier.
Key words: Downdraft gasifier, wood pellets, hot zone movement, quartz-tube experimental gasifier.
1. Introduction
With the pending energy crisis, there is a need to find alternative sources of fuel to provide energy, and renewable biomass sources are clearly beneficial from an environmental perspective. When using sources of biomass as a fuel, because biomass is bulky, transportation costs and their environmental impact favour local processing of the fuel to produce energy. Distributed sources of energy generation are also advantageous to reduce power losses in transmission lines. Hence there is a market to develop a wider range of gasification units, ranging in size, for example, from 50kWe up to 6MWe.
Discussions on the choice of technology to convert biomass into energy feature in a number of publications [1, 2], and the relative merits of pyrolysis, gasification and combustion are compared. In this paper, it was stated that the process of gasification, in a down-draft gasifier, was of special interest.
Although the general principles of biomass gasification are broadly understood, at a larger scale of operation (> 0.5MWe), there is still a lack of confidence in the translation of the basic scientific concepts into a financially viable operation that satisfies current regulatory requirements. This lack of understanding is evident from discussions with companies that are active in this field, and from discussions with companies that supply peripheral equipment who also highlight difficulties that their customers encounter.
The literature on the subject of gasification is extensive, with many books, papers and patents on the topic. To a newcomer into the field, a very useful reference with contributions from many experts is the book edited by Knoef [3], where the technologies and progress of many demonstration projects in Europe are described.
In this paper, the authors focus on the operation of a downdraft gasifier and start with a brief description of the main drying and reaction zones. Descriptions of such regions can be found in the literature. For examples, Dogru et al. [4] described their experimental 5kWe gasifier consisting of 4 distinct regions:
- Drying (70 to 100ºC): height approximately 100mm.
- Pyrolysis (350 to 500ºC): height approximately 170mm.
- Oxidation (1,000 to 1,200ºC): height approximately 120mm.
- Reduction zones (gases leave this zone from 200 to 300ºC).
In that particular design of test gasifier, there was clearly an axial temperature profile in the gasifier, and the regions as indicated in the paper had a significant depth. Biomass consumption rates varied from 1.73 to 5.4kg/ hour (optimum was 4.02kg/hour), and the diameter of the drying zone was 305mm which tapered through the pyrolysis zone, reaching a diameter of 450mm in the oxidation zone. This was then reduced to a throat diameter above the reduction zone of 135mm.
In a study of Sheth and Babu [5], 4 zones were also identified. The biomass consumption rates varied from 1 to 3.6kg/ hour. The diameter of the pyrolysis zone was 310mm, and that of the reduction zone was 150mm. The experiments were performed at equivalence ratios that varied from 0.167 to 0.355, and these affected the temperatures in the respective zones. For example:
- Drying.
- Pyrolysis (260 to 550ºC): height depends on biomass loading.
- Oxidation (900 to 1,050ºC): height approximately 53mm.
- Reduction zones: height approximately 100mm.
The highest temperatures in the pyrolysis and oxidation zones corresponded to an equivalence ratio of 0.205.
Even by looking at these last two studies, it is clear that although there are similarities in the design, there are big differences in the internal geometry and aspect ratios for a fixed flow of biomass, and the reported height of the various zones.
Much of the literature on gasifiers, and including descriptions in Earp [6], Evans [7], Milligan [8], Knoef [3], Sheth and Babu [5] and Dogru et al. [4], tends to provide explanations in which the results are portrayed looking at the bed from a one- dimensional (1D) perspective. As described in the literature review in Tinaut et al. [9], this is also evident in many modelling studies, and occasionally 2D models are encountered. However, in reality, the situation is far more complex. For example, the way in which the air is added will result in oxidation regions that correspond to the direction and shape of the expanding air jets, and this in turn will impact on the movement of the bed as biomass and char are consumed. A true representation of such a bed would require a three-dimensional (3D) consideration, and this would add complexity. This consideration is something that stimulated the work in this thesis, which tries to understand what is happening from a 1D perspective, which would help to interpret the 3D situation.
To help answer the questions raised, it was essential that the experimental gasifier had a visual section. Also, a decision was taken to keep the diameter of the test gasifier small, so that the associated experimental apparatus did not become too bulky, hampering progress. Therefore, in this paper, the decision was made to work with a 21mm i.d. quartz-tube, providing the key requirement of enabling visual observations to be made. In working with a small diameter gasifier, it was accepted right from the start that a compromise was being made on geometric aspects, but scale-down or scale-up was never the intention in this experimental unit. This decision turned out to be fortuitous, as it enabled a study to be made of the reacting zones where a 1D representation was closer to conditions in this experimental reactor, and this facilitated the explanation of phenomena occurring to match observations and measurements when a 3D environment exists.
2. Experimental equipment
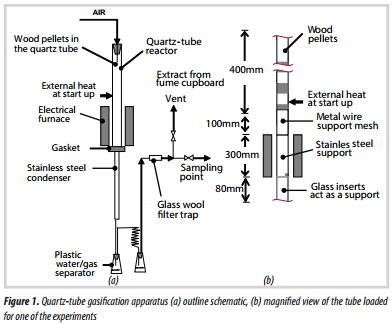
The apparatus is illustrated in Figure 1 and consists of the following key features:
- The gasification experiments were performed in a 21mm i.d. quartz-tube (wall thickness 1mm), that was approximately 1m long.
- At the top of the tube was a rubber bung, which provided some explosion relief. Through the bung, air was introduced into the reactor.
- The bottom of the quartz tube sat on a machined grove in a stainless steel bracket, and this was sealed with a gasket sealant (premium copper silicone). At the base of this bracket, a stainless tube was welded, and this bracket acted as the glass to metal joint.
- The base of the tube was positioned in a cylindrical, electrically heated furnace, whose temperature could be adjusted.
- In general, only the top section of the quartz tube (above the furnace) was filled with biomass pellets. The lower half contained an inert stainless steel support (to support the biomass), or it contained charcoal.
- The flow of air was measured with a rotameter, which had been calibrated. The air supply pressure at the top of the quartz tube was about 0.1bar (g).
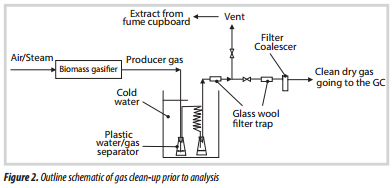
- From the base of the test section, the gas flowed through a cooler, and condensate was trapped in the first plastic vessel (Figure 2). The gas then passed through a cooling coil, where more of the liquid condensed. The gas was passed through a glass wool filter and then discharged into the vent from the fume cupboard.
- A clear safety screen was positioned in front of the quartz tube, and the entire apparatus was mounted inside a walk-in fume cupboard.
- After the glass wool filter, samples of gas were drawn from the exhaust line, and the composition of the dry gas was analysed using gas chromatography.
Start-up: To initiate the reactions inside the quartz tube, the external surface of the quartz tube was heated at a specific location with a blow torch, as illustrated in Figure 1b. Air was then added and oxidation reactions were initiated inside the tube. The external flame was then extinguished. The vigour, position, and height of the red- hot zone inside the quartz tube could be observed, and the composition of the resulting gas was also measured.
3. Experimental measurements
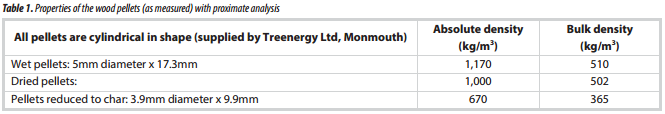
3.1. Properties of the wood pellets used
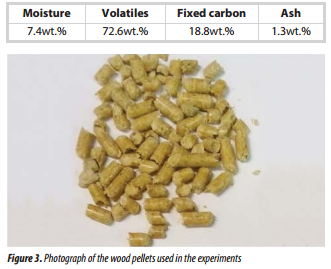
Commercially produced wood pellets were used in these experiments, and their key properties are summarised in Table 1. A picture of the sample used is presented in Figure 3.
3.2.Wood pellet gasification
Experiments were performed with the tube filled with wood pellets (5mm diameter, and 13mm long), to a depth of about 400mm. These were slightly shorter than the pellets described in Table 1. The biomass was supported on a stainless steel support, and the furnace was set at a temperature of 750ºC.
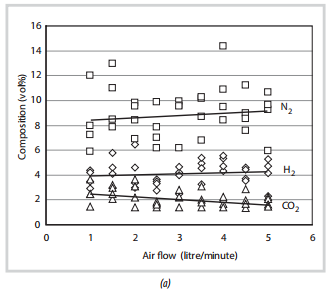
The results of the first set of experiments, in which reactions were initiated in the middle of the biomass zone, and without any insulation around the quartz tube, are presented in Figure 4. From these results, the following observations are made:
Gas composition:
- There is a significant amount of scatter in the data probably caused by the unstable nature of the reactions that are taking place in the hot zone.
- The concentrations of CO and H2 are small due to the fact that without any insulation around the quartz tube, a significant amount of heat was lost from the hot zone (mainly by radiation). Hence, this affected the composition of the gas produced, and this gas was not combustible.
- Astheairflow is increased, there is a slight increase in the concentrations of CO and H2, while the concentrations of CH4 and CO2 decrease. This is because with an increase of the air flow, more heat would be generated in the combustion zone, enhancing endothermic reactions, which produce more CO and H2, in the gasification zone. However, when air flow reaches a certain point where the combustion becomes dominant, more CO2 would be generated, leading to a decrease in the concentration of CO and H2 in the gas produced.
- The gas compositions produced from experiments with and without insulation around the quartz tube were very different, due to an important role of the insulation layer on the quality of the gas.
3.3. Movement of hot zone
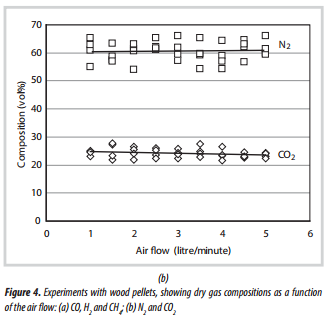
Because a quartz-tube was used, this enabled a visual observation to be made of the movement of the hot combustion zone, and this shows some very interesting features which are summarised in Figure 5.
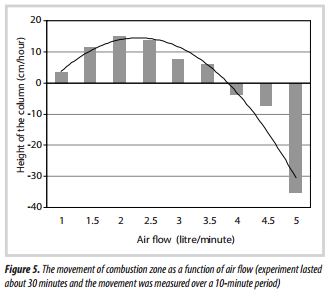
At an air flow from 1 to 3.5 litre/minute: in this region, the hot zone moved upwards, as illustrated in the photograph of the quart-tube in Figure 6. As the hot zone moved, the pellets were reduced in size and had the appearance of char.
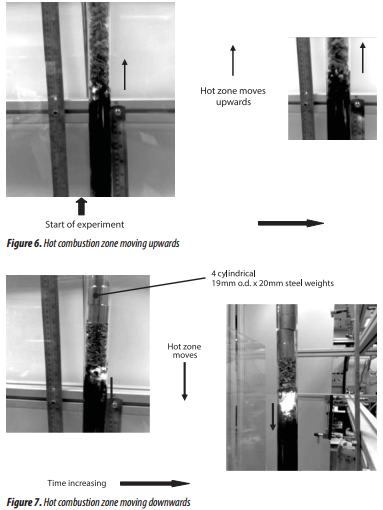
At an air flow of 4 litre/minute: the hot zone started to move downwards (Figure 7). As it moved, it consumed the char, turning it to ash.
At an air flow of 5 litre/minute: the hot zone moved downwards in a rapid manner.
In work by Hsi et al. [10], the movement of the combustion zone in the direction of the point of air supply was described in a down- draft experimental gasifier (200mm i.d. and 1,000mm height). An igniter was located 130mm above the grate and the air inlet was 530mm above the grate. On ignition of the bed, the flame front was found to propagate upwards to the location of the air inlets. This is consistent with the findings in Figure 7, where at relatively low air flows the combustion zone moves in the direction of the air supply. However, at very high flows, the direction changes - this aspect was not recognised in Hsi et al. [10].
In other studies, both Earp [6] and Evans [7] used a transparent quartz reactor (50mm i.d.) in attempts to measure the heights of reaction zones in an open-core (stratified) down- draft gasifier. Earp [6] employed pine and ramin (nominal size: 2.6 - 6.35mm), whereas Evans [7] used a variety of feed stocks (e.g. wooden beads and chips of different sizes) with the average feed rate of 1.27kg/hour. They both found that the movement of the flames (combustion zone) varied with the mode of operation, depending on the relative rates of char production by pyrolysis and char consumption by gasification. There were 3 modes, namely:
- Stable operation: there was no net production of char in the gasifier, leading to a stationary combustion zone observed;
- Char consumption (gasification) dominant operation: there was a net consumption of char in the gasifier, making a downward movement of the combustion zone;
- Pyrolysis dominant operation: there was a net production of char in the gasifier, resulting in an upward movement of the combustion zone.
Both authors concluded that the mode of operation is altered by varying the air to feed ratio in the gasifier. They explained the rise of the combustion zone as a result of greater heat loss in the pyrolysis dominant mode due to the increase of the char bed height. This led to less energy passed on to the gasification zone, and hence less char conversion [7]. Therefore, they both found that during pyrolysis dominant operation, there was a higher air requirement (or higher air to feed ratio) compared with stable operation.
However, using the same experimental apparatus, Milligan [8] proved that the mode of operation did not depend on the air to feed ratio, but on the superficial gas velocity within the gasifier. In other words, it relied on the air feeding flow rate. Milligan [8] used wood chips (nominal size: 4.75 - 12.7mm) with a feed rate of up to approximately 2.2kg/hour, and showed that even greater heat loss was experienced in the pyrolysis dominant mode, the sum of energy lost and the sensible heat of the products was approximately constant at 28% for all operation modes.
By calculating the pyrolysis and gasification propagation velocities for stable, pyrolysis dominant and gasification dominant operation, Milligan [8] showed that the rate of char production by pyrolysis was approximately the same for stable (96.7cm/hour) and pyrolysis dominant operation (99.7cm/hour), but was very much reduced for gasification dominant operation (37.2cm/hour).The rate of char consumption by gasification increased from pyrolysis to stable, to gasification dominant operation. Therefore, a rising combustion zone was a result of decreased char gasification, while a falling combustion zone was a result of decreased char production by pyrolysis and increased char consumption by gasification.
Milligan [8] finally concluded that during the gasification dominant operation, the decrease in velocity of pyrolysis propagation might be explained by the forced convection of heat away from the combustion zone as the air flow into the gasifier was increased, leading to a convective cooling effect in the pyrolysis zone. He added that as the flame was pulled downwards further into the gasification zone, the heat flow into this zone was enhanced (i.e. forced convection), resulting in an increase in the rate of char gasification. Hence, the rate of char gasification became increasingly dominant when the superficial velocity of gases through the reactor was increased (due to the increase of the air flow into the reactor).
The findings of Milligan [8] are almost consistent with the results gained in this study. For example, during what was as a stable operation, the movement of the combustion zone was -2.81cm/hour, at 49.5 litre/minute of air feed [8]. If this air flow was scaled-down to the 21mm
i.d. quartz-tube, this would correspond to an air flow of 3.9 litre/minute. From Figure 5, at an air flow of 4.0 litre/ minute, this would suggest a movement of the hot zone of -3.6cm/hour, which provides a close match.
Nevertheless, all three authors (Earp [6]; Evans [7]; and Milligan [8]) did not report the variation in the height of the combustion zone, which was discovered in this work, varying with either the air feed rate or the superficial gas velocity.
3.4. Height of hot zone
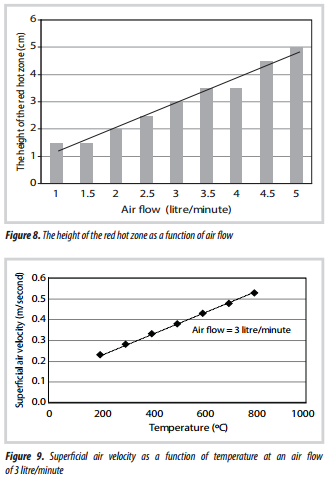
It was also interesting to observe that as the air flow was increased, the height of the hot zone also increased (Figures 6 - 8), and this can also be seen in the photographs in Figures 6 and 7.
From Figure 8, an indication is obtained of the height of the red-hot zone. For the range of conditions tested, this appears to vary with air flow in a linear manner. This zone is also relatively short, and this can be supported by interpreting some of the results in Tinaut et al. [9]. They studied an inverted fixed bed down-draft gasifier (50mm i.d.), in which the bed was ignited at the top, and air was supplied upwards from the base. This resulted in the hot zone moving downwards. Thermocouples were positioned at 30mm intervals, and one of the temperature plots (with air flow 12 litre/minute) provides a clue as to the length of the hot zone, which would be about 30mm. If their air flow was scaled-down to the 21mm i.d. quartz- tube, this would correspond to an air flow of 2.1 litre/ minute. From Figure 8, this would suggest a hot zone of 20mm, which, considering that the quartz tube is not insulated, provides a close match.
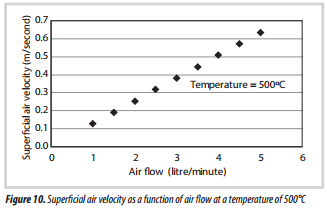
3.5. Superficial gas velocity
What is also interesting to note, is how the superficial velocity may vary in these experiments. As an illustration, at a fixed air flow of 3 litre/minute, the superficial velocity of air was calculated at a range of temperatures, and is illustrated in Figure 9. Then the superficial velocity is calculated at a fixed temperature of 500ºC, and over a range of air flowrates (Figure 10).
4. Experience gained from the gasification experiment
In this section, a number of important practical aspects are discussed, which also have links and implications on the performance of a pilot-scale gasifier.
4.1. Risk of tube fracture
The 21mm i.d quartz-tube lost heat quickly, so it was covered with an insulating sleeve (which was briefly lifted for visual observations). This in turn, under certain operating conditions, led to very high temperatures in the hot zone (e.g. 1,084ºC), and thermal stresses led to tube fracture. Care needs to be taken to ensure that in the event of the glass tube shattering, operatives would not be injured. This means that such high temperatures may also exist at local points in a pilot-scale gasifier - this aspect had not been fully appreciated by the two companies which remained in contact with this research project.
4.2. Biomass sticking on walls
As the reactions proceed in the hot zone and biomass is consumed, there should be a general downward movement of biomass in the tube. However, because of tarry material that is produced, this may coat the walls of the tube, the biomass may stick to the walls and not fall downwards into the void that has been created. Some form of vibration on the walls of the glass tube can help to keep the biomass moving. In any development of this experimental concept, it may be better to have a device inside the tube to keep the biomass moving downwards. These problems also exist in pilot-scale gasifiers, where “bridging” can occur between neighbouring particles, and the biomass may also adhere to the walls of the gasifier [11].
4.3. Slagging
If very high temperatures are reached, the ash may melt and cause a slag to form which restricts the performance of the experimental tube. In that case, the experiment was stopped, the equipment had to cool down, then the slag was removed. These problems also exist in pilot-scale gasifiers, and the melting point of the ash depends on the chemical composition of the biomass fed into the gasifier.
4.4. Tar formation
This was formed during the gasification experiments and was very visible in the lines and filters. To prevent an excessive build-up of pressure in the lines, they had to be cleaned frequently.
These problems also exist in pilot-scale gasifiers. However, attempts to remove the tar by cooling and water scrubbing create a waste water effluent stream, high in phenols [11].
4.5. Condensate formation
As the gas was cooled at the end of the quartz-tube, condensate was collected, and this contained mainly water and hydrocarbons. Some of the hydrocarbons formed a tarry layer, while others discoloured the water and formed an emulsion. These condensates looked dirty and smelt. These problems also exist in pilot-scale gasifiers, and the treatment of the waste water formed involves a number of steps, and is seen to be a costly activity.
According to Knoef [3], it may be possible to (a) avoid condensate being formed by keeping the temperature above the dew point up to the point of gas use, (b) clean the condensate, or (c) scrub with oil and subsequently recycle the tar back into the gasifer.
4.6. Gas quality
Depending on the operating conditions, the quality of the gas varied. This will also occur in the pilot-scale gasifier. Although gas analysis is an expensive activity, it is essential if the links between cause and effect are to be properly understood on a pilot-plant [11 - 13].
4.7.Char formation
During the experiments in the quartz-tube, char was formed and remained in the gasification tube. This char contains carbon, which could be reacted with H2O and CO2 to produce useful gas. However, in the experimental set- up, once the hot zone has moved and left the char, it cools and remains in the tube (until it is physically removed).
In a pilot-scale gasifier, char is also formed and withdrawn from the base of the gasifier. The appearance of such char was very similar to that observed in the quartz-tube gasifier, and it contained 25.57wt.% volatiles, 71.03wt.% fixed carbon, and 3.4wt.% ash in dry basis. If such biomass-to-energy processes are to become viable, then more of the carbon in this char needs to be converted into useful gas [14].
5. Conclusion
At the start of the experimental work, it was accepted that this small 21mm i.d. quartz-tube gasifier was not a scaled-down version of an operational gasifier. Nevertheless, this experimental apparatus has provided some very useful insights into the processes occurring inside the gasifier on issues, such as: gas composition and variations with air flow, direction of movement of the hot zone, peak temperatures in this zone, and depth of the hot zone, formation of char, and the role that carbon may play in the reduction zone.
Depending on the air flowrate, the hot zone may move upwards or downwards, and this has important implications for the way in which these zones can be visualised in a full-scale gasifier.
Acknowledgement
We are grateful for the support received from the Ministry of Education and Training of Vietnam in the form of a research grant for Dr. Le Dinh Chien and Dr. Ngo Thanh Hai.
References
1. A.V.Bridgwater. Renewable fuels and chemicals by thermal processing of biomass. Chemical Engineering Journal. 2003; 91(2-3): p. 87 - 102.
2. A.V.Bridgwater, A.J.Toft, J.G.Brammer. A techno- economic comparison of power production by biomass fast pyrolysis with gasification and combustion. Renewable and Sustainable Energy Reviews. 2002; 6(3): p. 181 - 246.
3. H.A.M.Knoef. Handbook biomass gasification (second edition). Biomass Technology Group. 2005.
4. M.Dogru, C.R.Howarth, G.Akay, B.Keskinler, A.A.Malik. Gasification of hazelnut shells in a downdraft gasifier. Energy. 2002; 27(5): p. 415 - 427.
5. P.N.Sheth, B.V.Babu. Experimental studies on producer gas generation from wood waste in a downdraft biomass gasifier. Bioresource Technology. 2009; 100(12): p. 3127 - 3133.
6. D.M.Earp. Gasification of biomass in a downdraft reactor. PhD thesis, University of Aston, Birmingham, United Kingdom. 1988.
7. G.D.Evans. Development and operation of an open- core downdraft gasifier system. PhD thesis, University of Aston, Birmingham, United Kingdom. 1992.
8. J.B.Milligan. Downdraft gasification ofbiomass. PhD thesis, University of Aston, Birmingham, United Kingdom. 1994.
9. Francisco V.Tinaut, Andrés Melgar, Juan F.Perez, Alfonso Horrillo. Effect of biomass particle size and superficial velocity onthe gasification process in a downdraft fixed bed gasifier. An experimental and modelling study. Fuel Processing Technology. 2008; 89(11): p. 1076 - 1089.
10. Chih-Lun Hsi, Tzong-Yuan Wang, Chien-Hsiung Tsai, Ching-Yuan Chang, Chiu-Hao Liu, Yao-Chung Chang, Jing-T.Kuo. Characteristics of an air-blown fixed-bed downdraft biomass gasifier. Energy & Fuels. 2008; 22(6): p. 4196 - 4205.
11. Le Dinh Chien, S.Kolaczkowski, D.W.J.McClymont.
Using quadrupole mass spectrometer for on-line gas analysis
- Gasification of biomass and refuse derived fuel. Fuel. 2015; 139: p. 337 - 345.
12. Le Dinh Chien, Ngo Thanh Hai, S.T.Kolaczkowski, D.W.J.McClymont. Carbonyl sulfide presence in syngas stream produced from biomass gasification processes: measurement and calculation. PetroVietnam Journal. 2016; 10: p. 48 - 53.
13. S.Kolaczkowski, Le Dinh Chien and S.Awdry. Equilibrium reactions(s) involving H2S and COS species - consideration of thermodynamics and implications on the biomass gasification process. In Proceedings of the bioten conference on biomass and biofuels 2010. Editors: A.V.Bridgwater. CPL Press UK. 2011: p. 733 - 744.
14. Le Dinh Chien, S.T.Kolaczkowski. Steam gasification of a refuse derived char: Reactivity and kinetics. Chemical Engineering Research and Design. 2015; 102: p. 389 - 398.